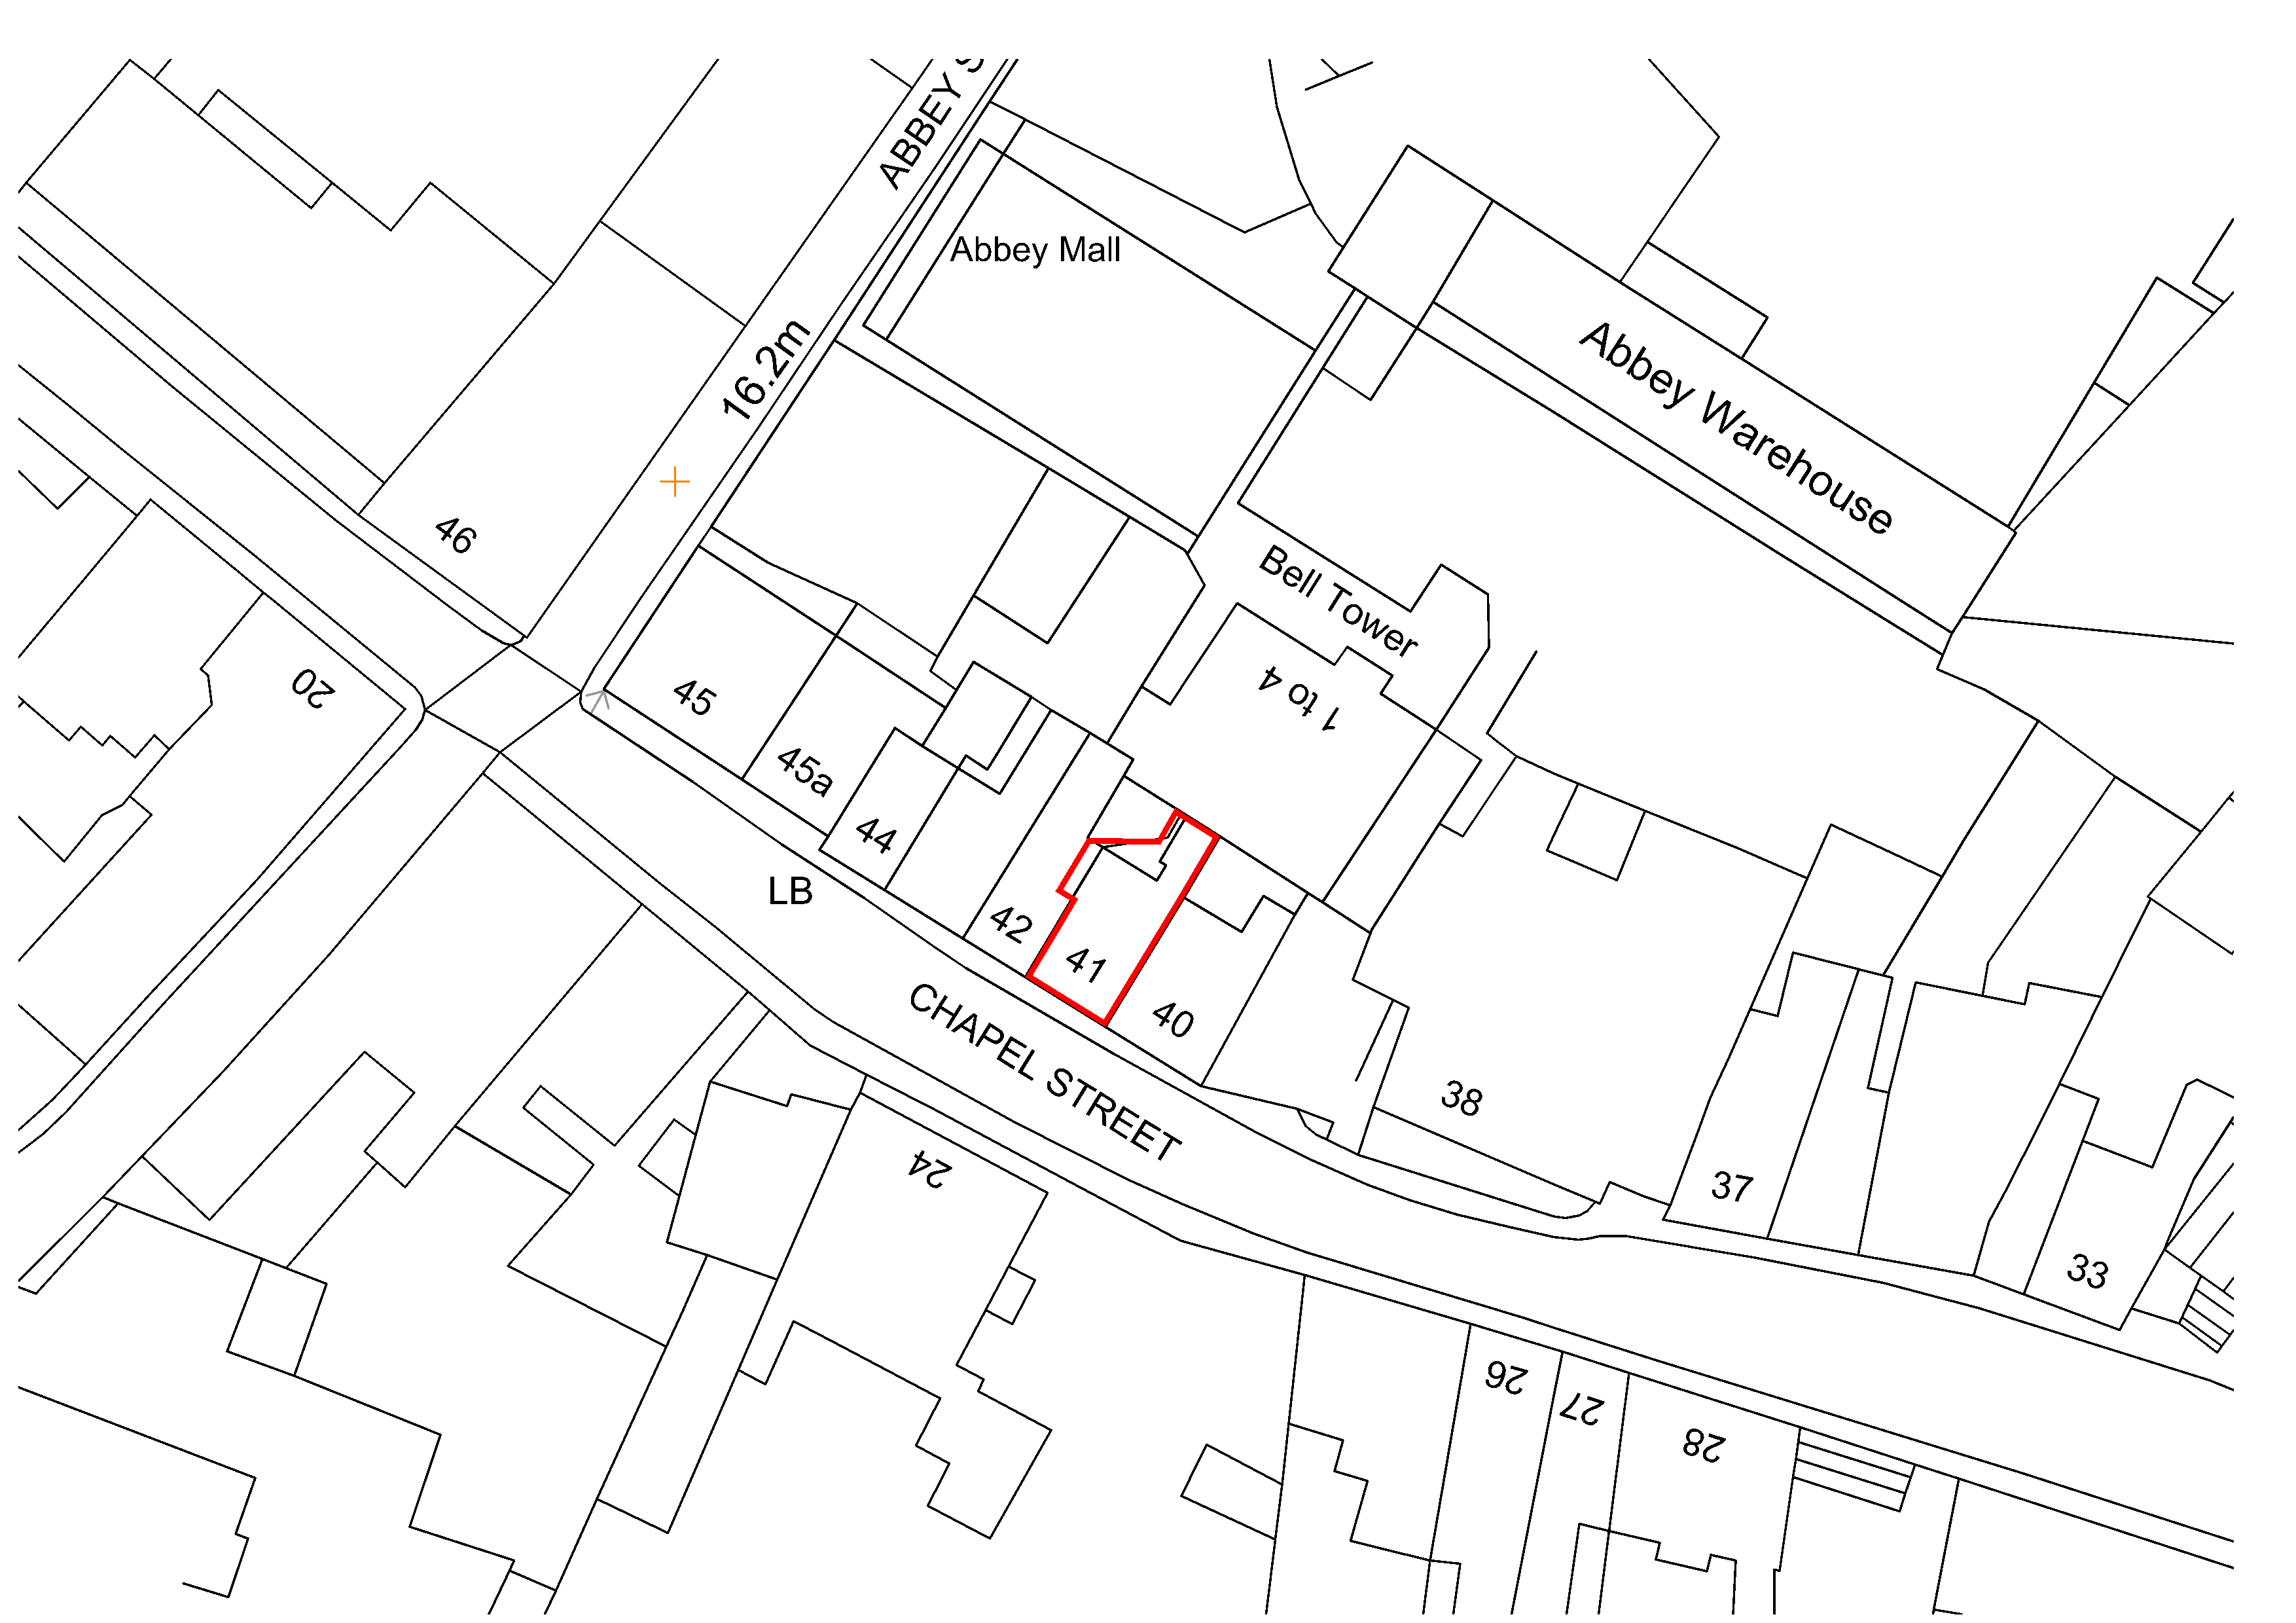
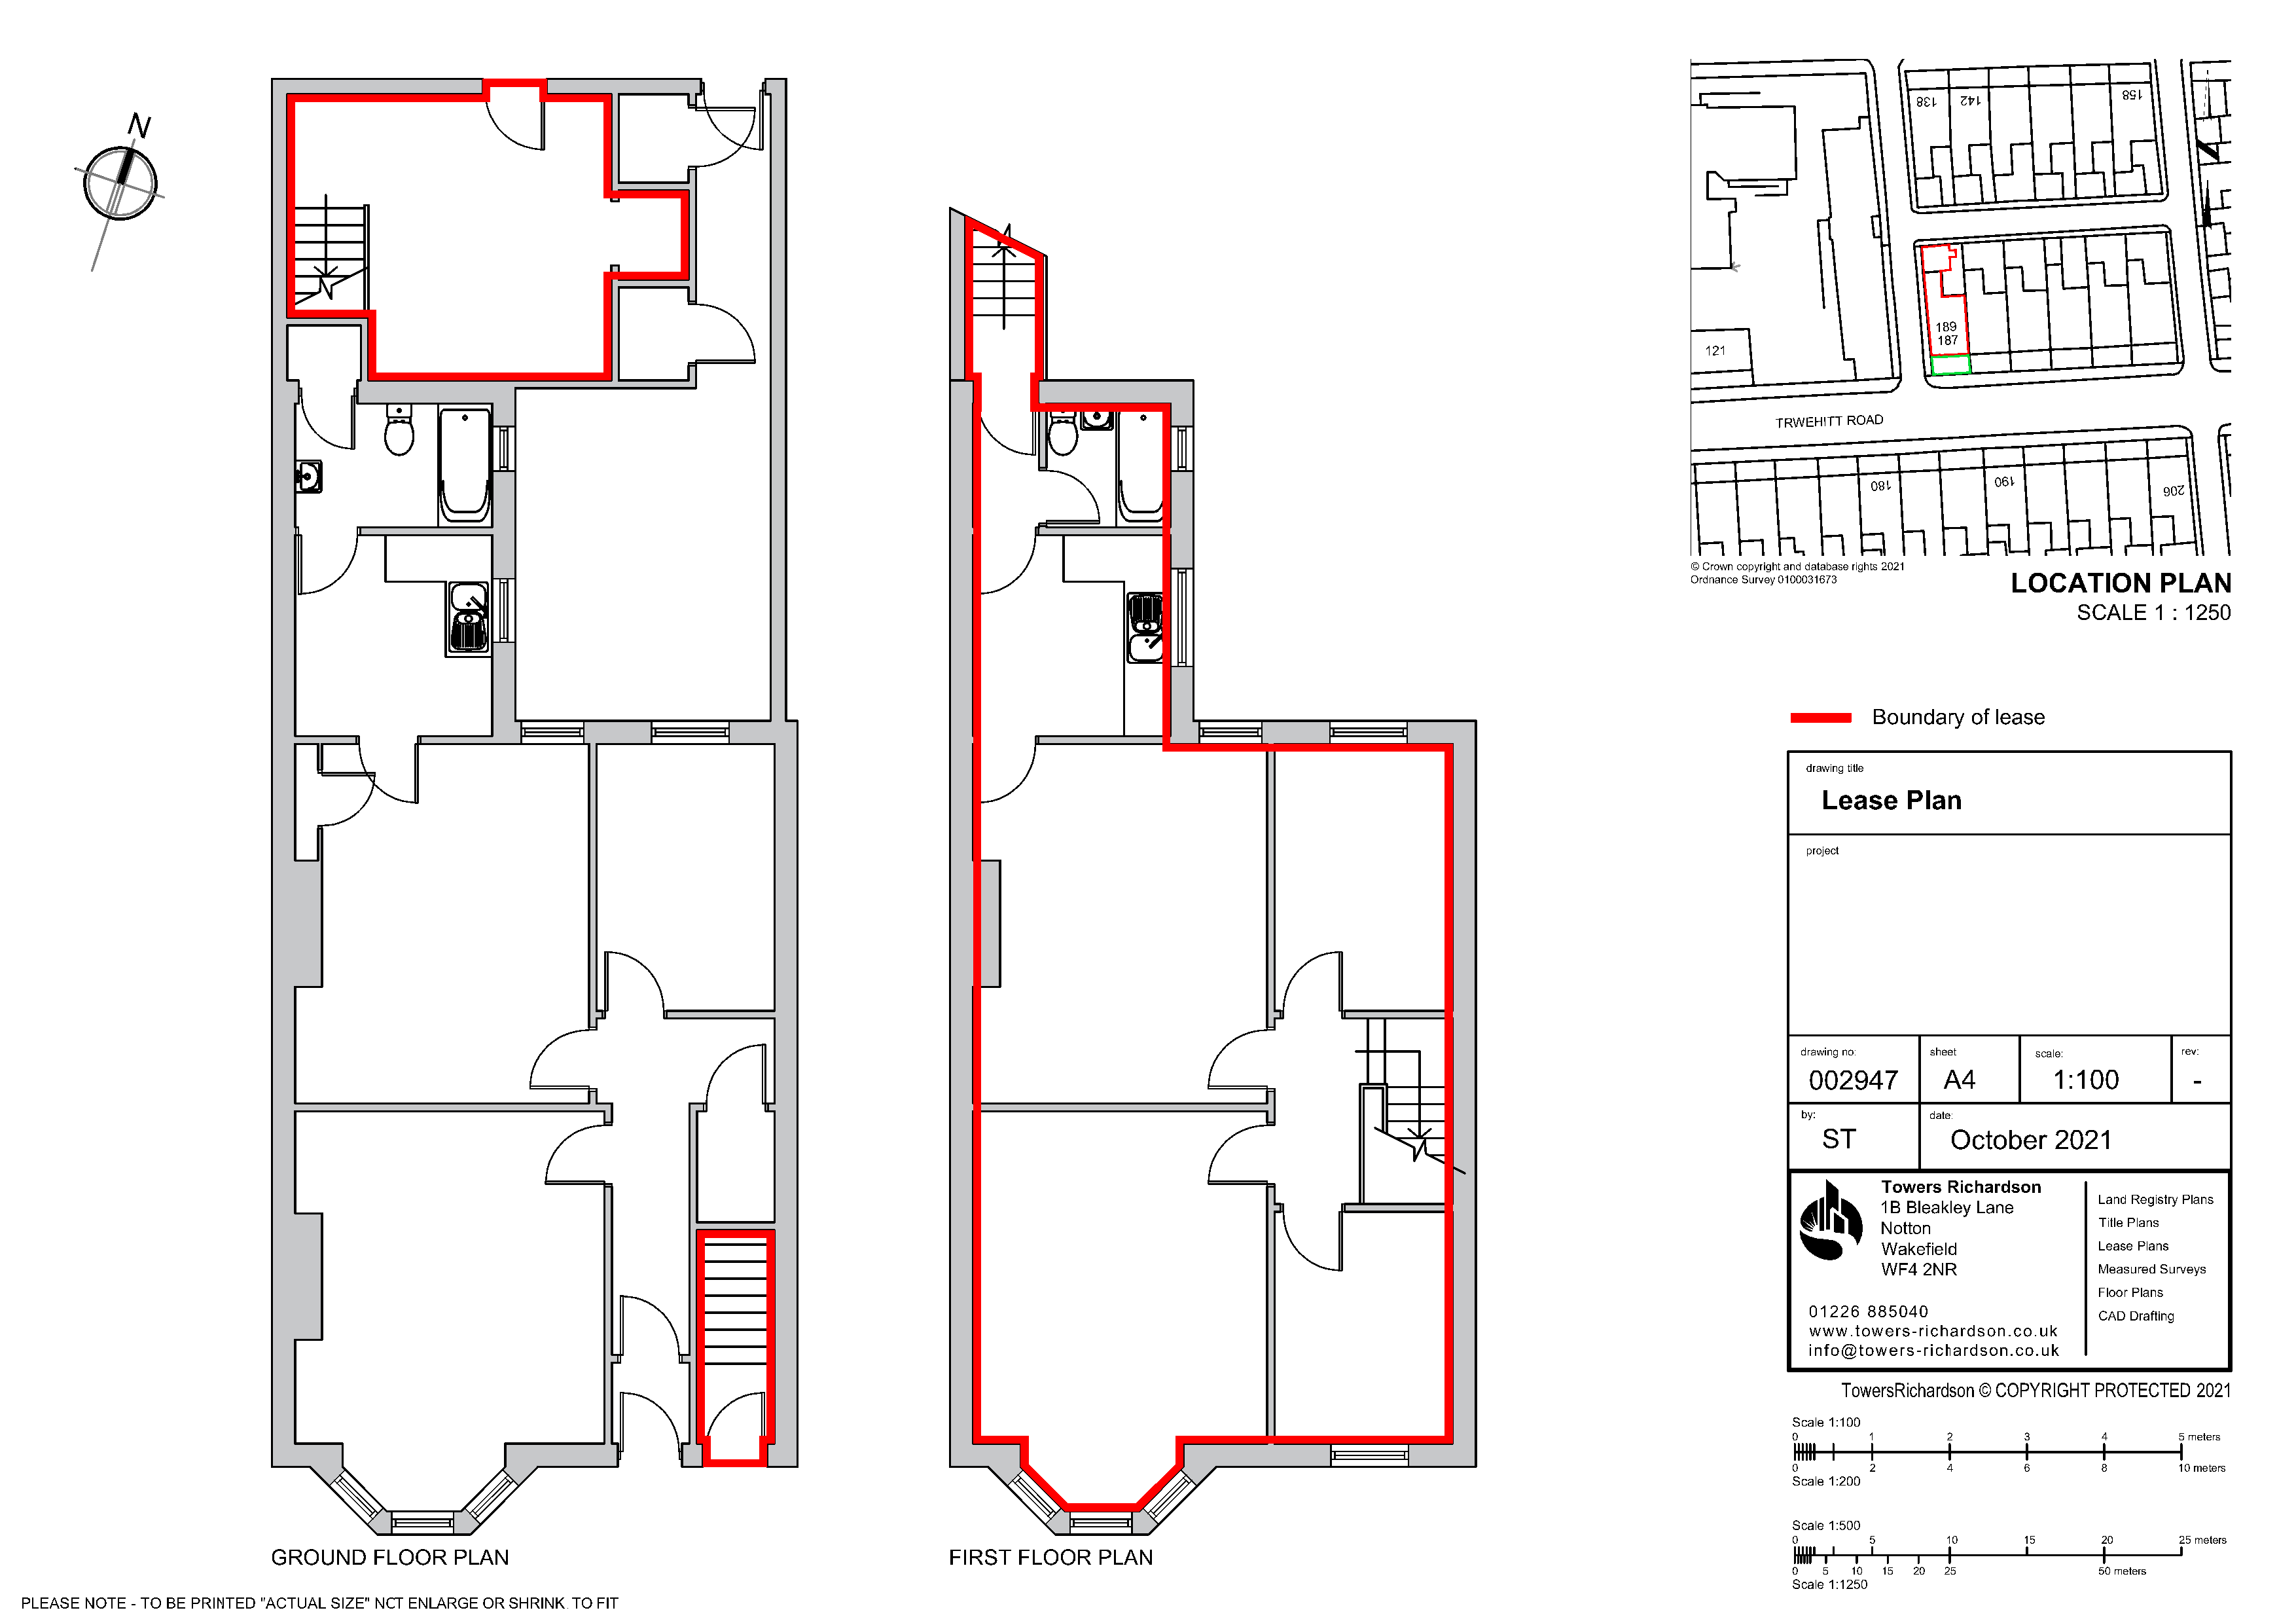
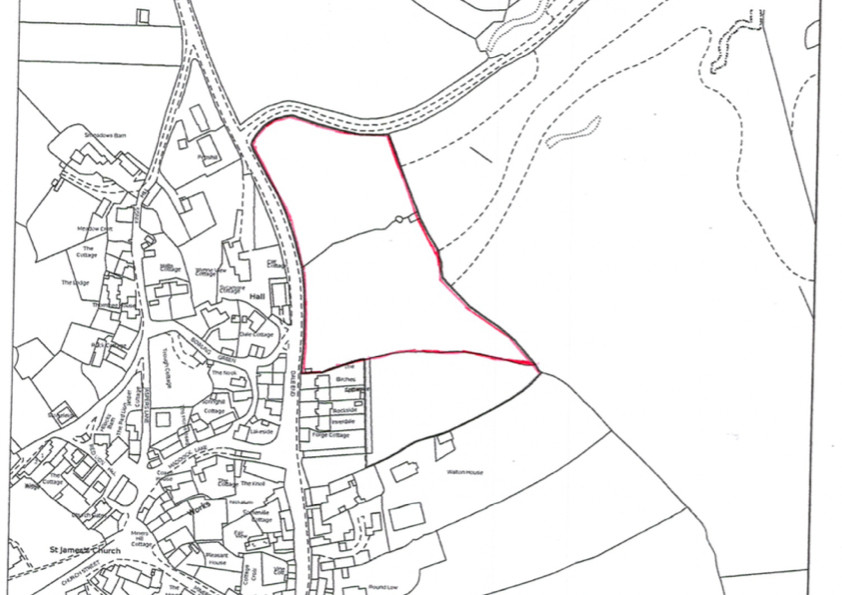
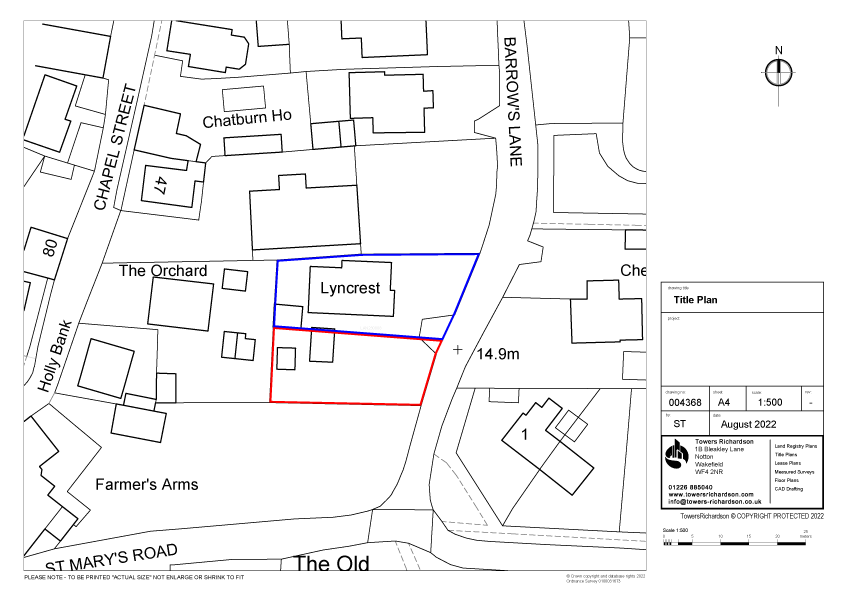
Scale and accuracy of Ordnance Survey mapping
Utilising their standard surveying and mapping processes, it is not possible for Ordnance Survey to replicate the exact position of each physical feature on the ground. The degree of variation between the ‘real life’ position and that recorded on the map is known as the specified accuracy tolerance. This will mean that measurements scaled between features shown on Ordnance Survey mapping may not exactly match the actual distance measured between the same features on the ground. Different levels of accuracy apply dependent on the scale of the map and the original survey method used to create it.
As a general guide, the width of a line on a 1:1250 Ordnance Survey map roughly represents 0.3 metres on the ground. The width of a line on a 1/2500 Ordnance Survey map roughly represents 0.6 metres on the ground. Ordnance Survey publishes expected confidence levels in the accuracy of their maps in terms of relative and absolute accuracy, which are summarised in Relative accuracy and Absolute accuracy respectively.
It is for these reasons that HM Land Registry is unable to provide scaled measurements from title plans or from Ordnance Survey mapping.
Where an Ordnance Survey map has been enlarged from its original scale, the degree of accuracy remains the same as the original map specification. For example, a plan surveyed at 1:2500 and enlarged to 1:1250 will still be subject to the survey specifications of 1:2500 mapping.
It should be noted that copying, reducing or enlarging a plan is likely to distort its accuracy.
Accuracy categories
The large scale Ordnance Survey mapping has been produced at different scales using different surveying methods resulting in varying degrees of accuracy.
There are four accuracy categories.
1:1250 scale
1:2500 scale resurvey/reformed
1:2500 scale overhaul. Maps originally recompiled from pre-1946 County Series mapping
1:10 000 scale.
Ordnance Survey describes accuracy in two ways.
Relative accuracy
Absolute or positional accuracy.
Relative accuracy
Relative accuracy is a measure of the positional consistency of a data point in relation to other local points of detail. Relative accuracy compares the scaled distance between features measured from the map data with distances measured between the same features on the ground. The following table represents the relative accuracy applicable to the scale of capture.
Relative accuracy
Scale Relative error 95% confidence limit 99% confidence limit Maximum measured distance
1:1250 (urban) <±0.5m <±0.9m <±1.1m 60.0m
1:2500 resurvey or reformed (urban and rural) <±1.0m <±1.9m <±2.5m 100.0m
1:2500 overhaul (urban and rural) <±1.8m <±3.6m <±4.7m 200.0m
1:10 000 (mountain and moorland) <±4.0m <±7.7m <±10.1m 500.0m
To put this in more practical terms, if, at a scale of 1:1250 the distances between well defined points of detail 60.0m apart were measured on the ground, there would be an expectation that 95 per cent would be represented on the Ordnance Survey map by scaled distances of between 59.1m and 60.9m. Similarly, at 1:2500 resurvey the measured distances between points of detail 100.0m apart there would be an expectation that 95 per cent would be represented on the Ordnance Survey map by scaled distances of between 98.1m and 101.9m.
Absolute accuracy
Absolute accuracy is the measure which indicates how closely the coordinates of a point in Ordnance Survey map data agree with the ‘true’ National Grid coordinates of the same point on the ground. As the true position can never be known exactly, the statistic is quoted relative to the best known position determined by precise survey methods. Ordnance Survey publishes the following expected absolute accuracy values for well-defined points within each category of mapping contained in the National Topographic Database.
Absolute accuracy
Scale RMSE* 95% confidence level 99% confidence level
1:1250 (urban) <±0.5m <±0.8m <±0.9m
1:2500 (rural) (resurvey or reformed) <±1.1m <±1.9m <±2.4m
1:2500 (rural) <±2.8m <±4.7m <±5.8m
1:10 000 (mountain and moorland) <±4.1m <±7.1m <±8.8m
*RMSE (root mean squared error) is the square root of the mean of the sum of the squares of the errors between the observations.
for more information on Ordnance Survey mapping please visit the Ordnance Survey here


